Dicamba and 2,4-D: History and Use
Here you can find information on the use of dicamba and 2,4-D at the national level and in the 13-state Heartland Study region. Click here to go to the main dicamba and 2,4-D page for more links and information.
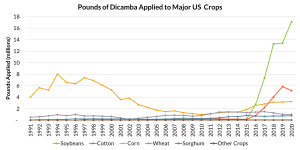
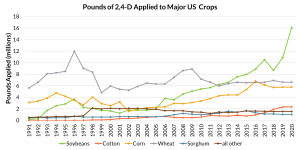
The first two figures shows the trends from 1991 through 2020 in the pounds of dicamba and 2,4-D active ingredients applied on all crops. Note that two crops — corn and soybeans or cotton — make up the majority of dicamba and 2,4-D use. These demonstrates the dramatic impact of GMO crops on use of these herbicides.
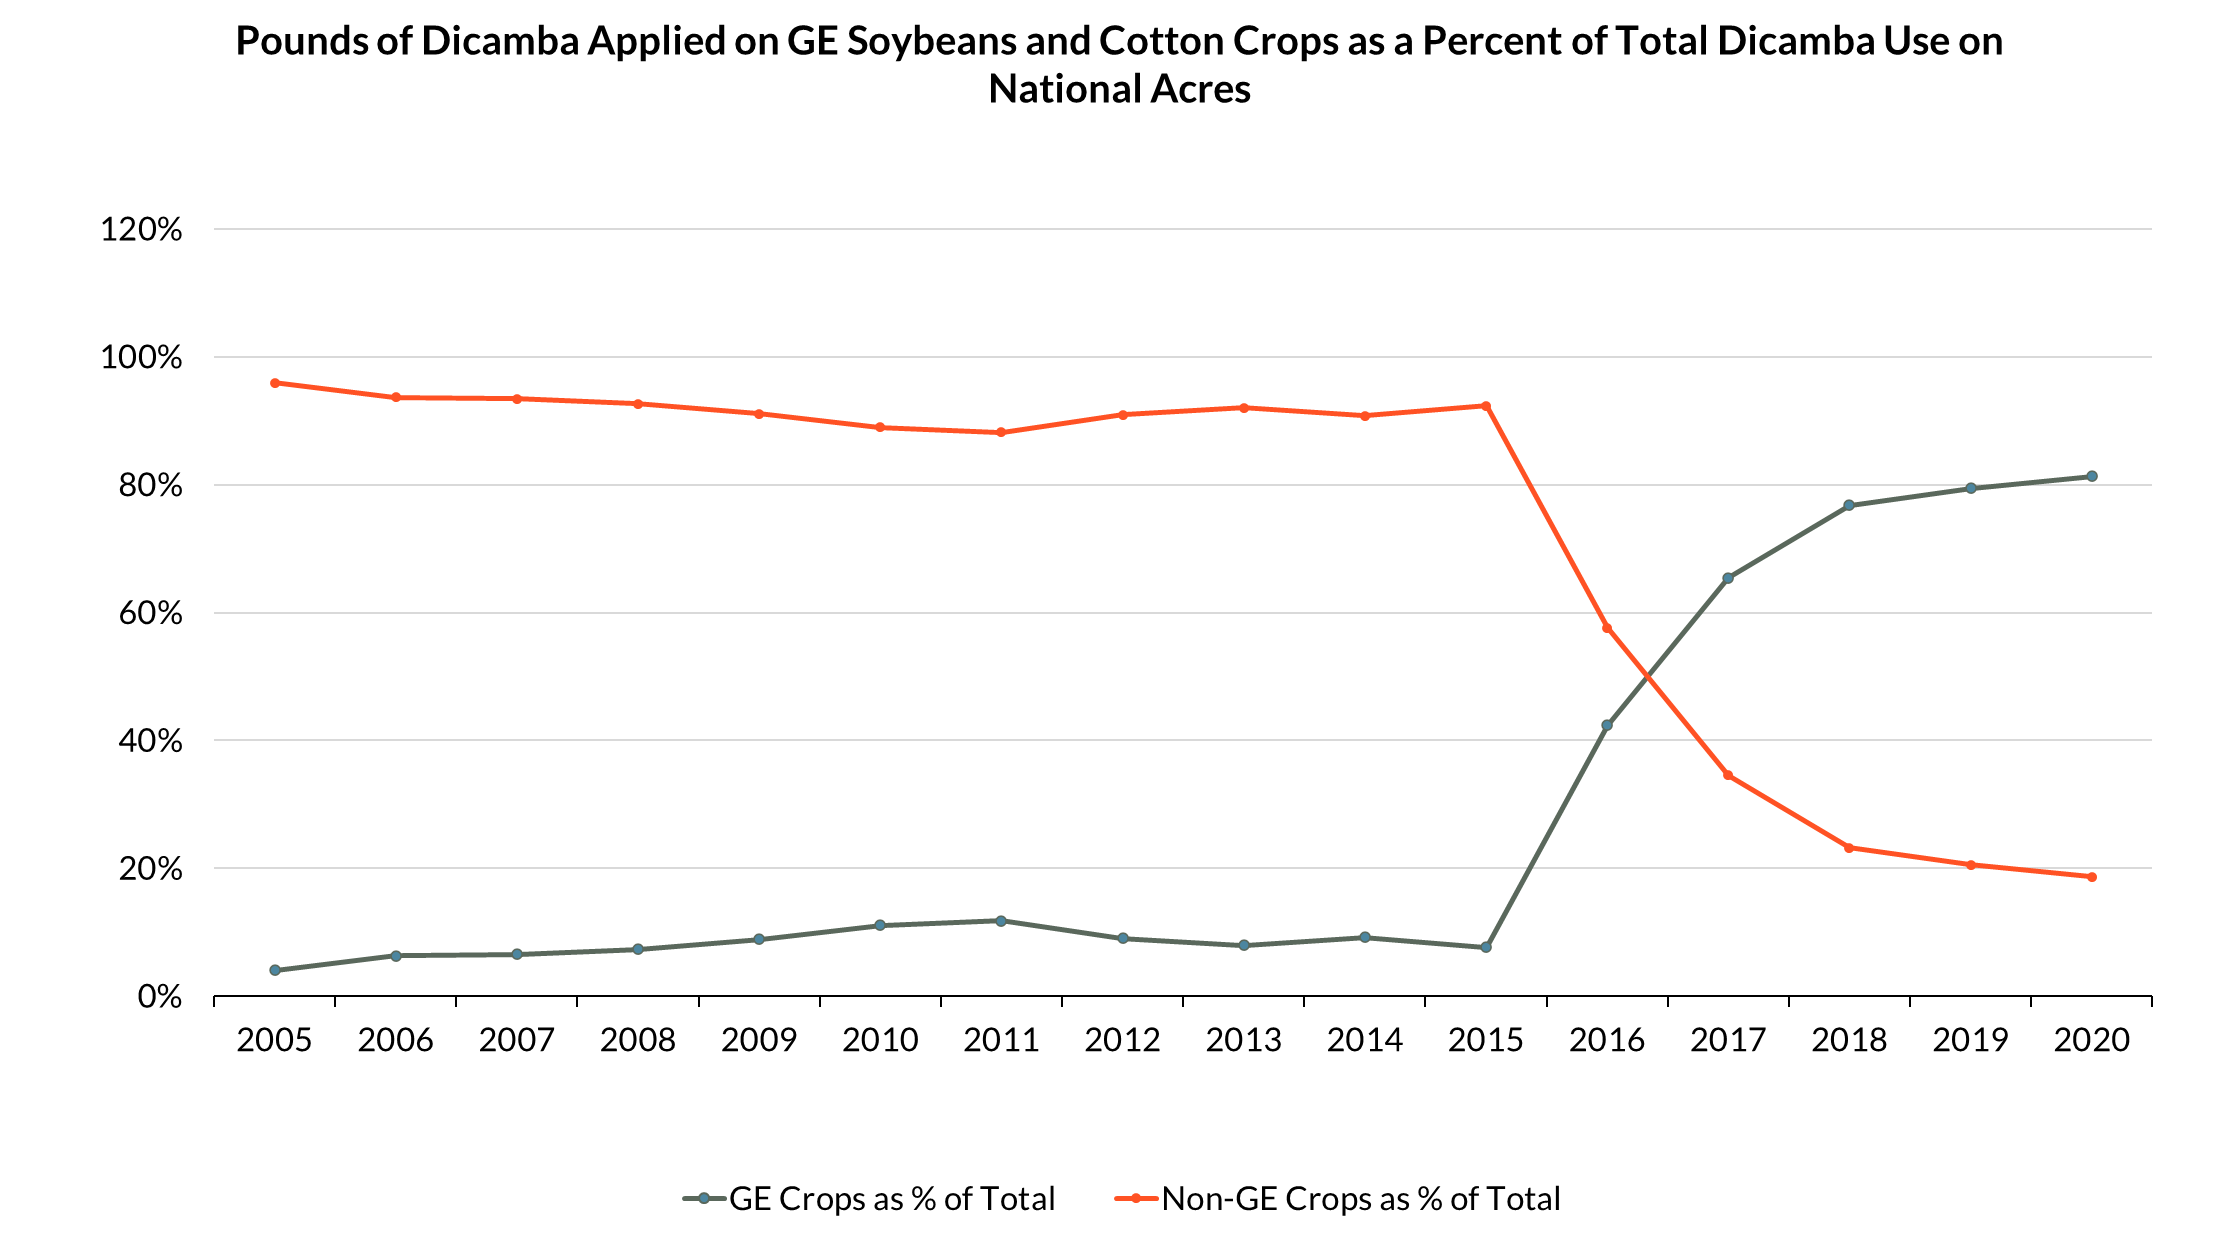
 The third figure shows the percent of total dicamba and use that is accounted for by applications on dicamba tolerant crops, in contrast to all other crops. The data in these figures is only an approximation of actual use patterns, since the USDA does not routinely report herbicide use on GMO acres in contrast to non-GMO acres. All figures also ignore the small percent of organic acres in each state sprayed with no herbicide.