
Is pesticide use going up, staying about the same, or declining?
This seemingly simple question requires careful thinking and a lot of data.
One might choose to focus on one or more of the following pesticide use metrics:
- The pounds of pesticides applied in an area in a crop cycle (usually a calendar year).
- The number of different pesticide active ingredients required to bring a crop to harvest.
- The number of different applications necessary to grow a crop, taking into account that many pesticides are sprayed more than once on the same field in a year.
But, measuring pesticide use by just pounds applied can be misleading. In fact, any single, individual way to measure pesticide use will sometimes be misleading.
That’s because some pesticides are applied at high rates per acre — 1 or more pounds, and even up to and over 100 pounds per acre. Yet other pesticides that do largely the same thing, and sometimes work equally well or better, might be applied at a much lower rate per acre — say 0.1 pound.
Switching from a pesticide applied at 2 pounds per acre to an equally effective pesticide applied at 0.1 pound should be 20-times better, right? Well, sometimes, but not always. Why?
Because pesticides control their intended targets in a myriad of ways. Some, very toxic chemicals effectively kill or otherwise control pests at very low doses. Others are not nearly so potent, or have a hard time sticking on or getting into the target pest, so more must be applied to ensure an effective dose comes into contact with the intended target. Environmental factors like rainfall, temperature, and soil type can alter how stable pesticides are once applied on a crop. Stable products remain active and effective for a longer period of time and can deliver more cost-effective control than pesticides that break down quickly in the enviroment.
And then there is the public health consequences of pesticide use. Many pesticides target pests where they are metabolically or developmentally vulnerable. Some pesticides work via a mode of action with no counterpart in mammals, while other pesticides pose human risks via the same mechanism through which they kill or control pests.
Why Measure Pesticide Use?
There are three major reasons to measure and track changes in pesticide use.
First, pesticides cost money. Farmers have to carefully scout pest levels in their fields, to know what problems they face and to decide which pesticides (if any) to apply, when, and how. Rising pesticide use usually means rising costs and shrinking profit margins.
If incrementally rising pesticide use is not stabilized, a farm will become economically — and perhaps environmentally — unsustainable.
Second, scientists and regulators working to understand and manage pesticide risks in the environment and among exposed people need up-to-date and accurate information on how much pesticide is being applied, where, and how.
Such pesticide use information is vital input data in the pesticide risk assessment and regulatory processes.
Third, pesticide use has a myriad of impacts on biodiversity, water quality, pollinators, endangered species, food chains, genetic evolution, and competition among species and within ecosystems. It plays an often ignored role in climate change. So citizens and scientists, policy-makers and pundits, all have a need to understand whether and how, and how rapidly, pesticide use is altering the world around us.
Solid and accurate pesticide use data is essential if we are to understand — and more effectively manage — how these chemicals impact life on earth, and the earth itself. HHRA is here to help fill this need.
Pesticide Use Data Sources
The primary source of publicly available pesticide use data is the U.S. Department of Agriculture (USDA). Through its National Agricultural Statistics Service (NASS), USDA collects annual data on pesticide use on many crops. Results are made available for several key pesticide use parameters at the state and national level:
- The acreage planted of a given crop in a state and nationally, or bearing fruit acreage in the case or orchards and vineyards,
- The percent of acres treated with individual herbicides, insecticides, fungicides, and other pesticides,
- The average one-time rate of application,
- The average number of applications per crop year or cycle, and
- Pounds of active ingredient applied.
USDA has collected and reported pesticide use data since the 1960s. The collection of “modern” and reasonably comprehensive data on agricultural pesticide use began in 1991.
The interactive pesticide use tables on this website draw on these USDA data, as does the Pesticide Use Data System (PUDS).
Pesticide use data for California is also reported by the California Department of Agriculture, and nationally by the United States Geological Survey.
Around the world, use data are usually reported in kilograms of pesticide active ingredient applied per hectare, rather than pounds per acre. Very few pesticide active ingredients are applied in a 100% pure form, but virtually all pesticide use data is based on pounds or kilograms of active ingredient applied.
Typically, adjuvants and surfactants and other so-called inert ingredients, are combined with the active ingredient in formulated, end-use pesticide products. Inert ingredients are added to herbicides to:
- Help sustain the active ingredient in the proper state (solid, liquid, gas),
- Facilitate mixing with other pesticides or liquid fertilizers,
- Assure the active ingredient sticks to plant leaves, even if it rains,
- Accelerate the penetration of the active ingredient into plant tissues, and
- Protect the active ingredient from normal degradation processes driven by sunlight, rain, and air.
Inert ingredients generally account for a few percent to one-third of the weight of a formulated pesticide.
A Minimum Dataset for Measuring Changes in Pesticide Use
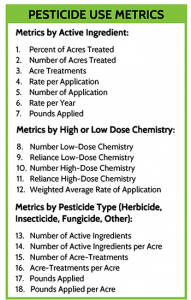
It takes a lot of information to fully and reliably answer the question — Has pesticide use gone up, down, or stayed about the same?
The HHRA has developed a pesticide use “minimum data set” composed of the 18 metrics spelled out in the box to the left. For a fuller discussion of the need for these 18 metrics, what they measure, and how they can be used together to answer basic questions about changes in pesticide use, click here.
The Heartland Study is relying on the 18 metrics in its research on changes in herbicide use. See our Interactive Pesticide Use Tables to explore these metrics and to learn how they have changed over time in the three main crops grown in the Heartland Study region — corn, soybeans, and cotton.