
How to Use the DRI
Before accessing the DRI system’s interactive tables, we encourage new users to visit About the DRI and study the system schematic.
As you begin accessing result tables, Interpreting DRI Values will help you understand DRI system Risk Metrics, how to determine How Risky is that Residue, and the relationship between DRI values and EPA dietary risk assessments and exposure thresholds.
A Step by Step Guide to Using the DRI
Here we provide guidance on how to access and use some of the basic the analytical features of the DRI system. The best way to learn how to use the DRI is to just dive in and generate some tables.
Step 1: Choose a DRI Module to Access and Study the Data
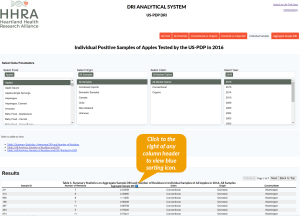
Access the DRI interactive tables here. You will enter the system at the screen shown below.
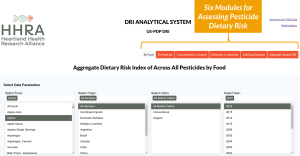
The first task is to pick one of the six modules in the DRI system. Each module is designed to generate tables helpful in answering different questions:
- By Food tables report the pesticide residues found in a given food in a year of residue testing. Suppose you want to know what were the riskiest pesticides in apples in 2016, you would start by clicking on the By Food module, and then click on “Apples.”
- By Pesticide tables list each food in which the chosen pesticide was detected in a chosen year of residue testing.
- Conventional vs. Organic tables report the residues and DRI risk levels in the organic samples of a given food compared to the residues and risk levels in the conventionally grown samples of the same food. In the DRI, “conventional” encompasses all samples except those labeled organic.
- Domestic vs. Imported tables allow comparisons of the residues and risk levels in a US-grown food compared to the imported samples of the same food.
- Individual Samples tables cover the residues and DRI levels for each pesticide found in a specific, individual sample of food. These tables provide the most realistic estimates of pesticide residues and risk levels in food as consumed and allow assessment of the distribution of risk levels across all samples tested of a given food, or across all foods.
- Aggregate Sample DRI tables report aggregate DRI values for each of the foods tested in a given year and rank foods by their contribution to overall DRI risk levels. These tables allow users to identify the foods contributing most significantly to pesticide dietary risks among those foods tested in a given year, as well as those foods contributing modestly to overall risk levels.
Step 2. Make Selections in the Drop Down Boxes
For every table the DRI generates, users must specify what samples the system should include when results are calculated and reported in a table. A user interested in how the risks from chlorpyrifos residues have changed since passage of the FQPA would go to the By Pesticide module, and in the “Analyte” drop-down box, select “Chlorpyrifos.”
The user would then need to make three more choices via drop-down boxes:
- “Origin” options allow the user to select “All Samples”, or domestically grown food, imported food, or imports by individual country.
- “Claim” gives users the option to select conventionally grown samples or organic samples, or all samples regardless of production system.
- “Year” refers to the year during which samples were collected and tested.
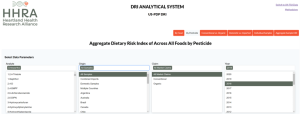
This screen reflects the above choices for 2018:
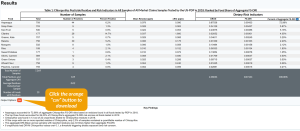
To gain perspective on how the FQPA impacted chlorpyrifos residues and risk levels, select and view the chlorpyrifos tables for 2019 and/or 2020, and then compare residues and risks to the chlorpyrifos table from 1996, the year the FQPA was signed into law. Tables can be printed directly from your browser, or downloaded as .csv files for analysis in your favorite database program. For example, the results table for chlorpyrifos residues in 2018 can be downloaded as shown below.
Each of the six modules in the DRI system takes users to a screen containing a set of “Select Data Parameters” drop-down boxes. Once each selection is made, tables reporting results based on those choices are generated automatically and the user can scroll down to review and download DRI system output tables.
Analytical Options
The DRI system provides users a number of optional ways to generate tables, and several ways to use the results within a given result table. Some of the important options are highlighted in this section.
Choose the Source of Residue Data
The DRI system contains the results of two high-quality residue testing programs:
- The U.S. Department of Agriculture’s Pesticide Data Program (PDP).
- The UK-Food Standard Agency’s pesticide residue testing program (UK-FSA).
 The US-PDP data in the DRI system span 1991 to the most recent year when data are available. Congress has directed the PDP to focus on foods that play a significant role in the diets of pregnant women, infants and children. The PDP tests a large number of samples of 10-25 foods per year.
 The UK-FSA residue program tests many more foods and a more diverse set of foods compared to the US-PDP, but far fewer samples of each food tested.
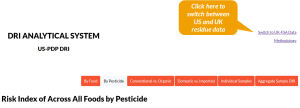
Both the US-PDP and the UK-FSA identify the country of origin of all samples tested, and select some samples of organic foods to test each year. Switch between datasets at the link on the top right of your screen as shown below.
Use the Sorting Function to Support Special Analyses
Each table generated by the DRI system can be sorted in a number of ways. To sort a given table by a specific parameter, place your cursor just below the header in a column to bring up the sorting arrow. Select how you want the data sorted and click on your preference. When the arrow in the sorting icon points downward, data will be sorted from the largest value to the smallest. When the arrow is pointed upward, values are sorted from smallest to largest.
Suppose you generated a table of “Individual Sample” results for all apple samples tested by the PDP in 2016. Table 1 results will appear as below.
Note that the results in this table are now sorted by “Aggregate Sample DRI”, from the highest DRI value to the lowest.
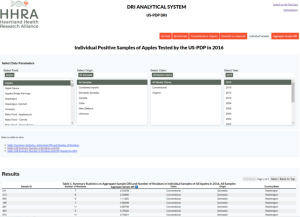
Let’s say you want to see which samples contained the highest number of residues. The answer is just a click away by using the sorting tool to sort by the column “Number of Residues”.
Three Ways to Calculate DRI Values
There are many ways to analyze and track pesticide dietary risks. Each provides useful insights, but also may tell only part of the story, especially in isolation. It takes three DRI-based metrics to reliably assess pesticide risks in any given food and across all foods and pesticides:
- The DRI-Mean (DRI-M),
- The Food Supply DRI (FS-DRI), and
- Individual Sample DRI.
The DRI value for a given food-pesticide combination is the ratio of the residue level of pesticidex in foody divided by the maximum acceptable level of pesticidex that can be in a serving of foody without exceeding the allowed daily intake of pesticidex as determined by the EPA.
Each DRI metric is discussed below, along with a visual representation of each measurement for apples tested by the US PDP in 2016.
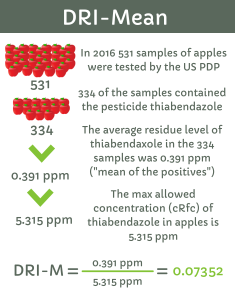
For a given pesticide-food combination, the DRI-Mean (DRI-M) is calculated based on the “mean of the positives” residue level in the food in a given year of testing.
Strengths and Applications
Easy to calculate. The DRI-M represents the most accurate estimate of the average DRI risk levels arising from consumption of a food known to contain residues of the pesticide in question.
Limitations
The DRI-M value for a given food-pesticide combination provides no information into how frequently a serving of food contains a residue of the pesticide in question. Two food-pesticide combinations might have the same DRI-M value of 0.1, but the percent of samples testing positive in one food might be 70% compared to just 2% in the other food. While these two foods would appear equally risky based on their DRI-M values, one would pose risks 35-times more often. The Food-Supply DRI metric accounts for this shortcoming in the DRI-M metric.
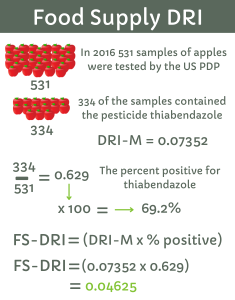 The Food-Supply DRI (FS-DRI) takes into account both the “mean of the positives” residue level, and the frequency with which residues are present in a given food. The FS-DRI is simply the DRI-M value multiplied by the percent of samples containing a residue of the pesticide in question.
Pesticide dietary risk is a function of how frequently a person is exposed to pesticides in their daily diet, as well as how risky each exposure is. The risk level arising from the presence of a given residue is determined by its level in food, the pesticide’s toxicity, and how much of the food is consumed in a typical single serving.
Strengths and Applications:
Easy to calculate. The FS-DRI value for a given food-pesticide combination provides an estimate of DRI risk levels arising from chronic long-term exposures to a given pesticide.
Limitations
The FS-DRI underestimates the acute or short-term risks associated with ingestion of a given residue. Sometimes consumers purchase fresh products or grain-based products in bulk. In such households, individuals will likely be exposed consistently to similar residues in the purchased food. Hence, the FS-DRI will either overestimate or underestimate risks for a majority of eating episodes.
Like the DRI-M, the FS-DRI provides little insight into the distribution of pesticide dietary exposures and DRI levels, since it is driven by the “mean of the positives” residue level.
 The Individual Sample DRI is based on the actual reported level of a pesticide in a single sample of food. Because this metric is specific to a single pesticide-food combination in one sample, the DRI-M value is the same as the FS-DRI. Individual Sample DRI values are real-world measures of DRI risk levels in selected foods.
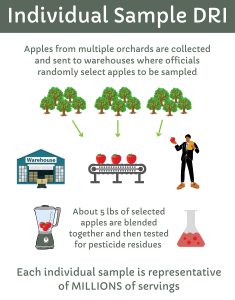
Each individual sample of a given food tested by the US-PDP is made up of about 5 pounds of product selected at random from the food supply. Each individual sample is actually representative of MILLIONS of servings annually of that food across the US population.
Process
For each pesticide analyte found in an individual sample of food, the DRI is simply the residue level divided by the maximum amount of the pesticide that can be in the food without exceeding the EPA’s “level of concern.”
Strengths and Applications
Easy to calculate. Accurately reflects the DRI risk levels in food as eaten by consumers. Provides key insight into the distribution of individual-sample DRI values for a given food. Provides perspective on the level of risks arising from consumption of foods with the highest DRI values, compared to foods with the lowest.
For most food-pesticide combinations, the distribution of individual-sample DRI values is highly skewed, with a small number of samples falling in the “significant” risk zone along the dietary risk continuum, and the majority of samples falling in the two lower-risk zones. Tracking down where and how the high-risk samples of a given food were grown is an important application of individual sample DRI tables.
Limitations
Individual Sample DRI values are accurate reflections of pesticide dietary risk relative to EPA-set exposure thresholds. The accuracy of individual sample DRI values — and indeed all DRI metrics — depends upon the quality of the toxicological data that the EPA used to set a pesticide’s cRfD or cPAD. Also, the way the US-PDP samples food likely increases the number of residues detected in some samples, while also lowering the reported residue level for each pesticide detected.
Most US-PDP samples come from warehouses where multiple sources of various fresh and processed foods are accessible. The typical US-PDP sample contains 5 pounds of product – fruits or vegetables, beans, grains, diary, animal products. Individual pieces of fruit and vegetables may be drawn from more than one supplier.
The 5 pounds of produce is then blended together into a composite sample that is then tested for pesticide analytes. Accordingly, the residues found in the composite sample might have come from crops grown on different farms and/or in different areas where a different mix of pesticides are commonly used.
Likewise, in the case of raisins and frozen mixed vegetables, the residues found in a composite sample also might have come from more than one farm and region.
Accordingly, a sample containing 10 residues does not necessarily mean 10 different pesticides were sprayed on the field or fields from which the food was harvested. In addition, by mixing together samples of food from multiple farms, the level of most of the pesticides detected in the composite sample will be lower than the actual level in some individual pieces of fruit or vegetable from a specific farm.
Index of DRI Pages
About the DRI
- The DRI as a Tool to Measure Pesticide Dietary Risks
- History of the DRI
- System Schematic
- Methodology Papers
- Dietary Risk Index (Benbrook and Davis, 2020)
- Individual Samples (Benbrook, 2022)