
Interpreting DRI Values
 Risk Metrics
The basic measure of food-pesticide risk in the DRI system is expressed relative to the maximum amount of a pesticide that can be ingested in a day without exceeding the applicable, pesticide-specific regulatory “level of concern.” All DRI system metrics are based on the weight and food intake of a four-year old child.
Such “levels of concern” are set by the EPA, or by other regulators elsewhere in the world, following assessment of the toxicology studies submitted by pesticide registrants in order to gain approval to spray pesticidex on cropy.
The DRI value for pesticidex in foody is a ratio. It is the residue concentration of pesticidex in foody divided by the maximum concentration of pesticidex that can be in foody without exceeding EPA’s “level of concern.”
For any given food-pesticide combination, DRI values exceeding 1 should trigger a regulator’s “level of concern.” This is because when DRI values are >1, the average residue of pesticidex in a single serving of foody exceeds the maximum daily level that can be in the food without over-exposing a four-year old child.
How Risky is That Residue?
 In the context of US law, the answer to the question “How risky is that residue?” depends on the level of dietary exposure to a pesticide that triggers EPA’s “level of concern.”
This level, in turn, is set by EPA in accord with the health-driven provisions of the Food Quality Protection Act (FQPA), a law passed in 1996.
The FQPA requires EPA to take into account the special susceptibility to pesticides of pregnant women, infants and children. EPA is directed to do so by, among other things, applying an additional 10-fold safety factor when setting a pesticide’s dietary exposure threshold called the chronic Population Adjusted Dose (cPAD).
EPA-set cPADs are usually one-tenth of the Agency’s corresponding chronic Reference Dose (cRfD). cPADs reflect the added safety factors imposed by EPA in response to the FQPA.
The added, usually 10-fold safety factor can be eliminated or reduced if and when the EPA Administrator determines that existing data and risk assessments adequately take into account the probable impact of pesticide exposures on pregnant women, infants and children.
For food-use pesticides, the EPA’s “level of concern” is reached when the Agency determines there is no longer a “reasonable certainty of no harm” from expected and measured levels of pesticides in food.
The EPA has interpreted the FQPA’s “reasonable certainty of no harm” standard to mean that the exposure level for a given pesticide at the 99.9th percentile of its estimated exposure distribution curve should be below the pesticide’s cRfD or cPAD. This “Threshold of Exposure” was set forth in a March 22, 2000 Federal Register Notice, “Policy Issues Related to the Food Quality Protection Act”.
Any DRI value greater than 1 exceeds EPA’s “level of concern” and cannot be deemed “safe” relative to the FQPA’s “reasonable certainty of no harm” standard.
How EPA Thinks About Pesticide Dietary Risk: The “Risk Cup”
 The EPA developed the “risk cup” concept to help people understand how it regulates pesticide residues in food. For each pesticide, the EPA’s evaluation of registrant-submitted toxicology data leads to the establishment of a chronic Reference Dose (cRfD) or chronic Population Adjusted Dose (cPAD). A cPAD is set when an additional FQPA-driven safety factor is applied to adjust a pesticide’s cRFD downward (make it more health protective).
Daily exposures up to the pesticide’s cRfD or cPAD do NOT trigger EPA’s concern and are considered “safe”. Exposure levels over a pesticide’s cRfD or cPAD are not deemed “safe”, but this does not necessarily mean that they are dangerous or damaging to human health.
The volume of a pesticide’s “risk cup” is proportional to the pesticide’s cRfD. The more toxic the pesticide, the lower the cRfD and the smaller the volume of the pesticide’s “risk cup”. The size of the risk cup for a four-year old child is much smaller than the risk cup of a 160-pound adult.
The FQPA requires EPA to add together the residues of a pesticide on or in each food it is registered for use on. This total “Aggregate Exposure” should not exceed the volume of the pesticide’s “risk cup.”
The risk metrics in the DRI system are closely related to the EPA’s dietary risk assessment policies. The DRI value for a given food-pesticide combination reflects the portion of the pesticide’s daily “risk cup” that is taken up by the residues in a single serving of the food consumed by a four-year old child.
It is easy to alter the weight of an individual within the DRI system, but the relative risk levels across food-pesticide combinations will not change unless relative serving sizes across foods also change.
The Dietary Risk Continuum
Pesticide dietary risks can be arrayed along a continuum from low to high risk based on their DRI values. The continuum can be broken into zones associated with incrementally higher risk levels.
The goal of pesticide testing and regulation is to assure the residues remaining in food are associated with risks below the regulatory “level of concern”.
The DRI system now generates “Individual Sample” tables with DRI values for a specific pesticide in a given sample of food. This allows placement of every food-pesticide combination in individual samples of food along the DRI Risk Continuum. The distribution of values along the continuum provides key insights into whether and how many samples contain possibly worrisome risks..
The DRI system uses five zones along the DRI continuum to assist in analyzing the distribution of risk levels in a given food in a year of testing. The five zones are:
- Very low-risk zone: Individual samples with DRI values < 0.01.
- Low-risk zone: Individual samples with DRI values ≥ 0.01 and < 0.1.
- Moderate-risk zone: Samples that fall between a DRI of 0.1 and 0.99.
- High-risk zone: Samples that range from 1.0 to 9.99
- Very high-risk zone: Samples that have DRI values of 10 or higher.
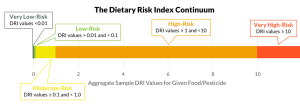 In the very high-risk zone, residues are present that eliminate at least one of the two 10-fold safety factors routinely incorporated in setting a pesticide’s chronic Reference Dose.
Residues in the very-low risk zone have an additional, at least 100-fold cushion between the estimated risk level and the regulatory “level of concern”.
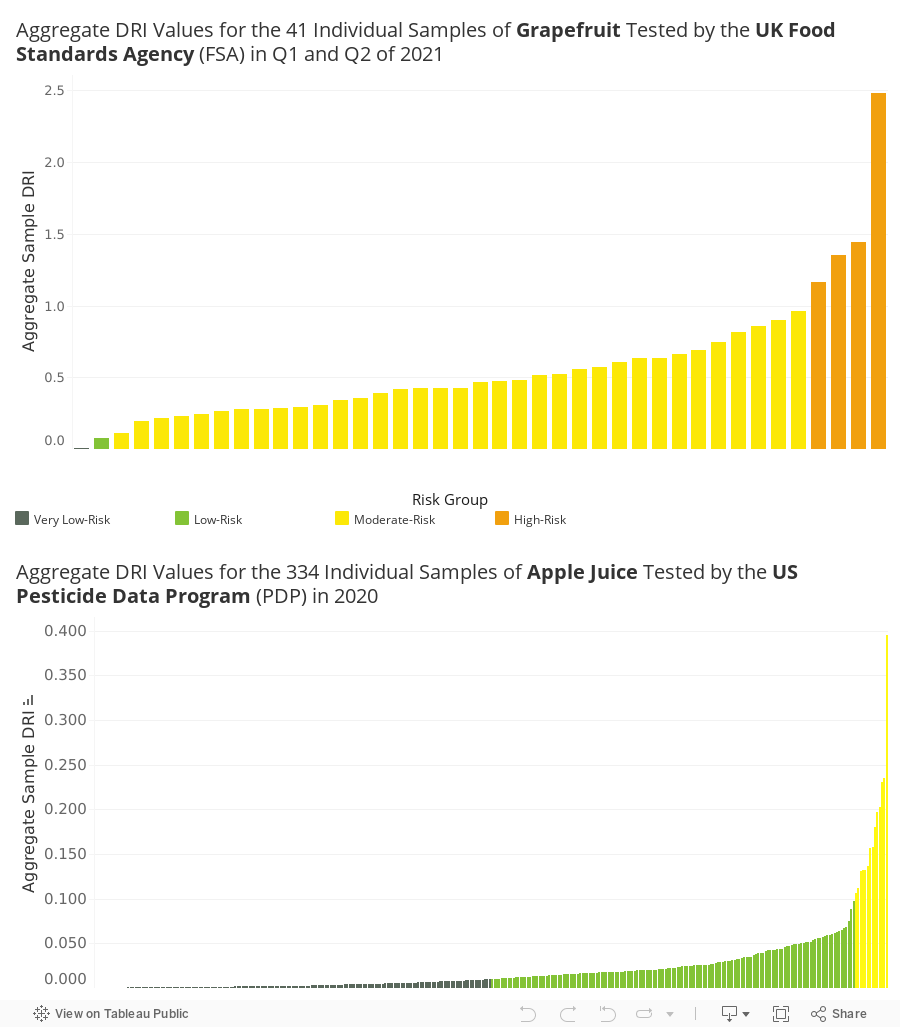
Two examples follow showing how the sum of DRI values across all pesticides found in a single serving of a food land along the DRI Risk Continuum. The first chart shows the distribution of risk levels across all residues reported by the UK-FSA in grapefruits in the first half of 2021. The second chart uses the same color coding by zone and shows DRI values associated with all residues found by the US-PDP in single samples of apple juice tested in 2020.
Most of the grapefruit samples tested by the UK-FSA in 2021 pose moderate to high pesticide dietary risks. The vast majority of residues found by the US-PDP in 2020 testing of apples fall within the very-low or low-risk zones along the Dietary Risk Index Continuum.
Levels of Aggregation
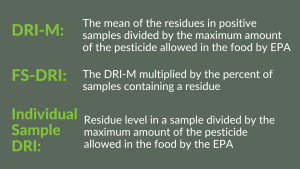
There are three forms of the DRI: DRI-Mean, the Food Supply-DRI and Individual Sample. (For details of the differences between these three DRI metrics, see Three Ways to Calculate DRI Values).
For a given food, DRI values can be aggregated, or added together, in three ways:
- All pesticides found in a given food in a given year.
- Summary data on a given food or across all foods reporting the number of residues found, the average number of residues per sample, and aggregate DRI values across all residues found in a given food.
- The residues and DRI values reported in Individual Samples of a given food, as well as aggregate DRI values in an Individual Sample across all residues detected in the sample.
Tables reflecting levels of aggregation #1 and #2 above can also be generated by pesticide-food combinations. These tables report all the foods in which a given pesticide was found in an annual set of residue test data. In most cases, one or a few foods account for the majority of aggregate food DRI.
Level of Aggregation #1 is the most detailed. It is designed to compare the contribution of a given pesticide found in a food to total, aggregate DRI values across all the pesticides detected in the food.
These tables spotlight “risk driver” pesticides in each food — pesticides that account for the largest share of total risk from all pesticides found in the food. It is equally valuable in identifying pesticides contributing modestly, or not at all, to aggregate dietary risk.
In these detailed tables, DRI values are calculated using the “mean of the positive” samples. But these tables provide no insight into the distribution of risk levels across all food-pesticide combinations.
Level of Aggregation #2 provides summary metrics associated with all the pesticide residues found in each food. These 2nd-level output tables include a row of data for each of the foods tested in a given year by either the US-PDP or the UK-FSA. The metrics reported include the number of residues detected, the average number of residues per sample, and aggregate DRI-M and FS-DRI values.
The tables also add up and report total DRI levels across all foods tested in a given year. The tables report the share of total risk accounted for by each food or by each pesticide detected.
2nd-level tables drive home the fact that in most years, just a few foods and a few pesticides account for 80% or more of total DRI risk, while one-half or more of the foods and pesticides tested contribute modestly or hardly at all to overall risks.
Recognizing “risk driver” foods in contrast to foods accounting for very low dietary risks is obviously helpful in targeting pest management R+D investments and promoting adoption of prevention-based biointensive Integrated Pest Management (bioIPM) systems on conventionally managed farms.
Level of Aggregation #3 provides the most accurate estimates of pesticide dietary risks because individual-sample DRI values are based on actual residue levels reported in each sample, rather than the mean of the positive residues found in all samples of a given food found to contain a residue of a pesticide.
The dietary-risk metrics in 3rd-level tables reflect actual residue intakes by consumers from one serving of a given food. Risk levels for each food-pesticide combination can then be ranked, highest to lowest and arrayed along the Dietary Risk Continuum.
Differences can then be explored between the riskiest samples and the least risky ones. The bigger the difference, the greater the opportunity to lower overall risks by targeting stricter regulation at high-risk food-pesticide combinations, coupled with new investments in developing and encouraging adoption of prevention-based IPM (Integrated Pesticide Management) systems.
Limits of the DRI
DRI values are only as accurate as the data used to compute them.
High quality, extensive pesticide residue data are now available from the US-PDP and UK-FSA. Both datasets have been incorporated in the DRI system. Still, many foods, and multi-ingredient foods like pizza or a sandwich, have never been tested by the US-PDP or the UK-FSA.
In general, greater confidence can be placed in the DRI’s residue-data-driven numerator, than in the tox-data-driven DRI denominator (the maximum amount of a pesticide that can be in food without exceeding regulatory “levels of concern”).
 The DRI denominator is called the “Chronic Reference Concentration” (cRfC) and is measured as milligrams of pesticide per kilogram of bodyweight. It is calculated from a pesticide’s chronic Reference Dose or chronic Acceptable Daily Intake (see Benbrook and Davis, 2020 for full details)
The dietary risk-assessment methods used by EPA and European regulators produce a single estimate of a pesticide’s chronic toxicity, based on the adverse response that occurs at the lowest dose among all toxic effects observed.
Some pesticides pose one, or just a few types of risk, the worst of which may quickly dissipate soon after exposures end.
Other pesticides may cause several possible adverse effects, some of which may be essentially irreversible. Some types of adverse effects are well recognized and carefully studied (e.g. eye irritation), while others are not (e.g. pesticide impacts on the microbiome and epigenetic effects).
EPA-set cRfDs and EFSA-set chronic ADIs do not generally take account of the diversity or severity of adverse biological outcomes that a given pesticide might cause.
However, a current cRfD or cADI might be protective of all adverse biological responses, if the current cRfD or cADI is actually based on the most sensitive endpoint.
Regulators have the tools needed to ensure that existing dietary risk thresholds are rarely, if ever, exceeded. The fact that other risks may exist from exposures to certain pesticides does not diminish the need to mitigate known risks.
Index of DRI Pages
About the DRI
- The DRI as a Tool to Measure Pesticide Dietary Risks
- History of the DRI
- System Schematic
- Methodology Papers
- Dietary Risk Index (Benbrook and Davis, 2020)
- Individual Samples (Benbrook, 2022)